Insight article
The Pelotas Basin: A rising global exploration hotspot
10 Jul 2025
Read Time
11 mins
Authors: Sindre Bull-Jansen*, Javier Martin, Christian Strand, Karen Purcell and Mustafa Al-Waily
Abstract
The Pelotas Basin in Southeast Brazil is rapidly emerging as one of the world’s most promising regions for hydrocarbon exploration.
This paper examines the impact of the recent exploration successes in its geological conjugate, the Namibian Orange Basin, where multibillion-barrel discoveries have been made over the past four years.
The success in the Orange Basin is particularly significant in addressing key uncertainties related to source rock presence and maturation, as well as reservoir in the Pelotas Basin. Shearwater, in collaboration with Searcher Seismic, is leveraging critical insights from the Orange Basin to unlock the exploration potential of the Pelotas Basin. Seismic analysis clearly identifies striking similarities between the two basins within the Early Cretaceous target interval, helping to de-risk key uncertainties related to source rock and reservoir presence.
Similar to the Orange Basin, quantitative interpretation techniques have shown potential AVO anomalies, providing valuable guidance for prospect identification.
Introduction
Driven by the recent success along the Orange region of Namibia, the Pelotas Basin, located offshore Southeast Brazil, is rapidly emerging as a high-potential frontier for hydrocarbon exploration. However, the limited availability of geophysical and geological data implies a degree of uncertainty regarding the key elements of the petroleum systems along the basin. This uncertainty has, in turn, traditionally affected exploration activities in the region. Recent advancements in high-end seismic acquisition and processing technology targeting known Cretaceous plays in Namibia and Pelotas have led to renewed interest. This growing confidence is reflected by the successful 2024 licensing round and, more recently, by the high number of blocks nominated in the Pelotas Basin under the 5th Cycle of the Permanent Offer Acreage in Brazil.
The Hydrocarbon Potential of the Orange Basin and Its Relevance to the Pelotas Basin
Despite the recent seismic acquisition campaign, the Pelotas Basin remains a frontier region due to the limited geological knowledge derived from sparse drilling activities and geophysical data acquisition to date. However, driven by its strong geological similarities with the conjugate Orange Basin, Pelotas stands as a very promising region for future exploration efforts. Evidence for these basins being conjugate is the emplacement of the large Parana-Etendeka Igneous Province (LIP) on both sides of the Atlantic during the Western Gondwana break-up. Further support comes from extensive geochronological analysis (Turner at al, 1994; Renne et al, 1992 and 1996) which supports the conjugate relationship between the Pelotas and Orange Basins.
Following multiple discoveries along the Orange Basin, beginning with Graff (Total, 2022) and Venus (Total, 2022) and followed by La Rona (Shell, 2022), Mangeti (Total, 2022), Jonker (Shell, 2023), Lesedi (Shell, 2023), and Mopane (Galp, 2024), the Orange Basin is now one of the most promising petroleum basins globally. The interplay between basin evolution, source-to-sink sedimentation, and tectonic configuration has contributed to putting the ingredients in place to make the case for this basin to be defined as one of the most prolific in recent decades.
Starting with the Early Cretaceous break-up and associated large volumes of lava extrusion (which presumably influenced the prolific Kudu Aptian Source Rock maturation), the high Aptian reservoir heterogeneity and diverse paleo-depositional environments (ranging from microbial carbonates to deep marine turbidites and fluvial to lacustrine clastic), have shaped the petroleum system configuration throughout the basin.
The geological similarities allow the prolific Early Cretaceous play in the Orange Basin to be traced effectively along the Pelotas Basin. An extensive stacked volcanic flow system, manifested as Sea Dipping Reflectors (SDR) formed during rifting, has been unequivocally identified in the same tectonostratigraphic interval in both basins. This volcanic configuration is presumed to play a crucial role in the overlying Aptian Source Rock maturation. The mature type II Aptian source rock encountered in ultra-deep marine settings within the Orange Basin and overlying the SDR was originally deposited in a restricted anoxic shallow marine environment, analogous to the conditions observed in the Pelotas Basin. The paleomorphology developed by basinal tilting related to gradual thermal relaxation created the physiographic conditions to develop effective trapping mechanisms pinching out towards the paleo relief.
The similarities between the two basins, including the potential for structural and stratigraphic traps, provide a promising outlook for future exploration campaigns. As exploration continues to evolve in both regions, understanding the shared geological frameworks and petroleum systems will be key to unlocking the full hydrocarbon potential of the Pelotas Basin.

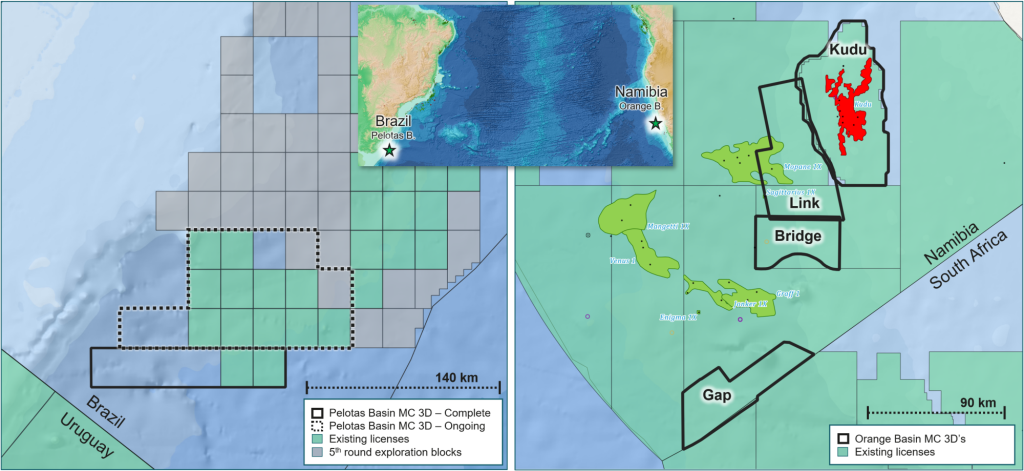
Figure 1 Location of the Pelotas Basin (left) in relation to Orange Basin (right) showing overview of licenses, fields andexisting and ongoing MC 3D seismic surveys.
In partnership with Searcher Seismic and NAMCOR (National Petroleum Corporation of Namibia), Shearwater has acquired and processed more than 12,000 km² of multi-client (MC) 3D seismic data of prospective acreage in the Orange Basin shown to the right in Figure 1. Building on the learnings from the Orange Basin, Searcher Seismic and Shearwater commenced a multi-year program in 2024 to acquire and process over 10,000 km² of high-quality MC 3D seismic in the Pelotas Basin shown to the left in Figure 1.
Quantitative Interpretation
De-risking reservoir and hydrocarbon presence by Amplitude Versus Offset (AVO) analysis is common within the Orange Basin. Strong AVO sensitivity in the subsurface arises due to pronounced contrasts in properties, such as P-wave velocity, S-wave velocity, and density, across lithological boundaries or fluid contacts. These contrasts create variations in reflection amplitude with offset, making AVO analysis a powerful tool for fluid versus lithology discrimination.
In this paper, we take a simplified approach to Extended Elastic Impedance (Whitcombe et al., 2002) using pre-conditioned angle stacks to calculate the AVO intercept and gradient based on Shuey’s two-term AVO equation (Shuey et al., 1985). Based on the work presented by Went et al. (2025), intercept and gradient are used to project out to a chi (χ) angle of 27 degrees (rEEIχ27), which is considered optimal for discriminating sand from shale and de-risking fluid content in this environment.
Acquisition and Processing – Optimal data for depth imaging and AVO
The 3D survey, acquired in the Pelotas Basin, was specifically designed to target the Cretaceous plays in deep water settings. To optimize the survey, a wide streamer spread was deployed, consisting of 10 streamers spaced 150 meters apart, along with triple sources, providing a 25-meter crossline bin size. Long offsets were essential to achieve a broad range of angles at the target depth for AVO analysis and to provide deeper penetrating diving waves, crucial for building an accurate velocity model through full waveform inversion (FWI).
To understand the impact of the streamer length on velocity model building a chequerboard test was run. The starting velocity model was created for the test by smoothing the imaging velocities and then adjusting with a grid perturbation of +/-3%. FWI was performed on forward-modelled seismic data using offsets of 8 and 10 kilometers. As shown in Figure 2, adding the extra 2 kilometers of offset significantly increased the penetration depth of the diving waves, allowing for deeper updates to the velocity model. Extending the offsets from 8km to 10km enhanced the overall seismic data quality, providing more accurate velocity profiles essential for subsequent processing and interpretation.

Figure 2 The starting velocity model (upper left) was perturbed with a grid of +/-3% scalars (upper right), and FWI usingdiving waves was performed on the real data with 8km (lower left) and 10km (lower right) offsets, quantifying the benefitfrom the extra offsets. A 2000 xline increment corresponds to 12.5km
Shearwater and Searcher Seismic are currently acquiring the second season of multi-client 3D seismic data in the Pelotas Basin as part of a multi-year program. In the first season, two streamers were extended from 8 kilometers to 10 kilometers. In the second season, the full spread of 10 streamers was all deployed with 10 kilometers due to increased water and target depths to further enhance data quality.
Utilizing the processing experience from the Orange Basin, a robust and state-of-the-art processing sequence is applied to these data. These techniques included sparse inversion de-blending, shot-by-shot de-signature with NFH data, 3D de-ghosting and de-multiple, with a particular focus during these stages on denoise, due to conditions encountered during acquisition.
The complexity of the seafloor structures required the use of curvelet domain subtraction for the model-based de-multiple techniques, along with high-resolution radon de-multiple and diffracted multiple attenuation as shown in Figure 3.

Figure 3 Common Channel display showing complexity in seafloor structures. The Complex water-bottom related multipleis well modelled by 3D SRME and successfully attenuated using curvelet domain subtraction. a. input, b. output, c.model.
Results
Conjugate Margin – De-risking Source Rock and Reservoir Presence
The newly acquired 3D seismic data from the Pelotas Basin reveal striking geological similarities with the Orange Basin, reinforcing the potential for hydrocarbon exploration. Figure 4 compares a depth-processed full-stack seismic section from the Orange Basin with a fast-track time-migrated seismic section from the Pelotas Basin at a similar scale, highlighting key indicators of Aptian source rock presence. Both basins exhibit strong seismic reflectivity associated with Aptian-Albian marine shales, which have proven to be effective source rocks in the Orange Basin. This correlation suggests the presence of an excellent source rock in the Pelotas Basin, de-risking one of the primary uncertainties in the region.

Figure 4 Dip lines in time at a similar scale from Pelotas Basin full stack fast-track 3D (left) and the Orange Basin full stackpre-SDM (right).
Quantitative Interpretation – FWI Velocity Model QC and Validating Reservoir Presence in Frontier Exploration
The normal derivative of an FWI velocity model often referred to as the FWI image highlights rapid changes in the velocity model. As illustrated in the 12 Hz FWI example from Pelotas Basin in Figure 5 (right), it reveals geological discontinuities and stratigraphic boundaries. By comparing the normal derivative to the seismic, interpreters can validate whether observed velocity variations align with actual geological features or result from inversion artifacts. This quality control (QC) process is particularly valuable in improving velocity model reliability, ensuring better depth positioning, and enhancing subsequent imaging and quantitative interpretation workflows.
AVO intercept is linked to pressure wave velocity variations in the subsurface because it represents the zero-incidence angle reflection amplitude. At zero incidence angle, the reflectivity at an interface is a derivative of the acoustic impedance (P-wave velocity X density) variation across that interface. Based on this, AVO intercept can serve as an effective QC tool for the normal derivative of an FWI velocity model, especially in frontier areas with no well control. In Figure 5 we demonstrate this by comparing the Pelotas Basin 12 Hz FWI normal derivative and the 12Hz low pass filtered AVO intercept. The strong correlation suggests that the 12Hz FWI is nicely picking up the details we should expect to see based on acoustic impedance variations in the subsurface. This approach can also allow us to highlight discrepancies between the two, potentially indicating valuable information about density variations in the subsurface.

Figure 5 Comparisons in time between fast-track full stack, 12 Hz FWI, fast-track AVO intercept low pass filtered to 12Hzand 12 Hz FWI normal derivative. A reference surface is included as a red stippled line.
AVO analysis further strengthens confidence in the hydrocarbon prospectivity of the Pelotas Basin. By applying a simplified Extended Elastic Impedance (EEI) approach using pre-conditioned angle stacks and Shuey’s two-term AVO equation, intercept and gradient projections were made to a chi (χ) angle of 27 degrees (rEEIχ27). This methodology, based on the findings of Went et al. (2025), has demonstrated its effectiveness in discriminating sand from shale and identifying fluid content variations. In Figure 6, we compare a dip line from the Orange Basin Gap MC 3D pre-SDM (see Figure 1) against a dip line from the Pelotas Basin fast-track at a similar scale. Overlain is the rEEIχ27 attribute highlighting AVO class 2/3 anomalies at primary target levels. Examples from both basins exhibit strong AVO response, potentially indicating lithology and fluid variations.

Figure 6 Seismic dip lines in time from Orange Basin (top) pre-SDM full stack and Pelotas Basin (bottom) fast-track fullstack. Overlain is the rEEIχ27 attribute highligting potential AVO class 2/3 response as a soft response.
To verify some of the anomalies observed in Figure 6, RMS amplitude at the primary targetlevel is extracted from the rEEIχ27 and shown in a 3D view for each basin in Figure 7. Theexamples show high-amplitude continuous reflections, indicative of potential deepwaterturbidite systems, slope channel complexes and basin floor fans. These are provenreservoirs in the Orange Basin (e.g., Venus and Graff discoveries), and the fast-trackrEEIχ27 comparisons highlight the potential presence of similar reservoirs in the PelotasBasin.

Figure 7 3D view in time of approximately 500km2 area of Pelotas Basin (left) and Orange Basin (right) showing RMSrEEIχ27 amplitude extraction at the primary target interval indicated in Figure 6. High-amplitude continuous reflections,indicative of potential deepwater turbidite systems, slope channel complexes and basin floor fans can be seen in bothbasins.
Conclusion
The Pelotas Basin is emerging as a compelling exploration frontier, supported by itsgeological similarities to the highly prospective Orange Basin. Key uncertainties related tosource rock and reservoir presence are addressed through advanced seismic acquisitionand processing, quantitative interpretation, and comparative analysis with the OrangeBasin’s proven hydrocarbon plays.Recent seismic data from the Pelotas Basin reveal strong correlations with the OrangeBasin, including Aptian source rock indicators, stacked volcanic sequences, andanalogous depositional environments favorable for high-quality reservoir development. Theapplication of integrated FWI velocity model building and AVO analysis, has providedrobust insights into subsurface characteristics. Preliminary results demonstrate that ClassII and III AVO anomalies in the Pelotas Basin align with known hydrocarbon-bearing sandsin the Orange Basin, reinforcing its exploration potential.The collaborative efforts between Shearwater and Searcher Seismic are driving atransformative shift in the understanding of the Pelotas Basin. As exploration advanceswith continued seismic acquisition and interpretation, the region is positioning as a risingglobal exploration hotspot.
Acknowledgements
We would like to thank Shearwater P&I, along with our partners on the data, SearcherSeismic and NAMCOR in Namibia, and Searcher Seismic in the Pelotas Basin, for theirvaluable contributions to the development of these datasets and the insights they providein understanding the respective basins.
References
Hedley, R., Intawong, A., Winter, F., and Sibeya, V. (2022). Hydrocarbon play concepts in the Orange Basin in light of the Venus and Graff oil discoveries. First Break, 40, 91-95.
Hodgson, N., Found, L., Rodriguez, K. (2024). Delivering Sands to Venus and all the Traps between: Orange Basin, Namibia. First Break, Volume 42, Issue 7, Jul 2024, p. 55 – 57
Mello, M.R., Mohriak, W., and Silva, J. (2021). Source Rock Potential of the South Atlantic Basins: A Comparative Study with the Orange Basin. AAPG Bulletin, 105(4), 675-690.
Renne, P. R., Glen, J. M., Milner, S. C., and Duncan, R. A. (1996). Age and Petrogenesis of the Etendeka Volcanic Rocks of Namibia. Geology, 24(7), 659-662.
Renne, P. R., Milner, S. C., and Duncan, R. A. (1992). 40Ar/39Ar Geochronology and Geochemistry of the Etendeka Volcanic Province, Namibia. Journal of Volcanology and Geothermal Research, 50(1-2), 77-94.
Shuey, R. T. (1985). A simplification of the Zoeppritz equations. Geophysics, 50(4), 609–614.
Turner, S., Regelous, M., Kelley, S., Hawkesworth, C., and Mantovani, M. (1994). Magmatism and Continental Break-up in the South Atlantic: High Precision 40Ar/39Ar Geochronology. Earth and Planetary Science Letters, 121(3-4), 333-348.
Went, D., Bamford, M., Rogers, J., Brown, S., and Turner, G. (2025). Characterizing hydrocarbon discoveries and prospects in the Tay Sandstone using relative elastic inversion: Greater Pilot area, Central North Sea. Energy Geoscience Conference Series, 1(1). https://doi.org/10.1144/egc1-2023-37
Whitcombe, D. N., Connolly, P. A., Reagan, R. L., and Redshaw, T. C. (2002). Extended elastic impedance for fluid and lithology prediction. Geophysics, 67, 63–67. https://doi.org/10.1190/1.1451337
Related articles

Multi-client data paving the way for success in the Pelotas Basin

Reshaping multi-client in an evolving market
